Case study 01 / 04
Product strategy · Design systems
Rebuilding trust in a wealth platform
A strategy sprint and design-system programme that turned a sprawling investment dashboard into a calm, legible product clients actually open.
At a glance
- 41%
- More weekly active clients
- 90 days after launch
- −58%
- Support tickets about balances
- 3.2×
- Faster feature delivery
- Median cycle time
- 4.7
- App-store rating
- Up from 3.1
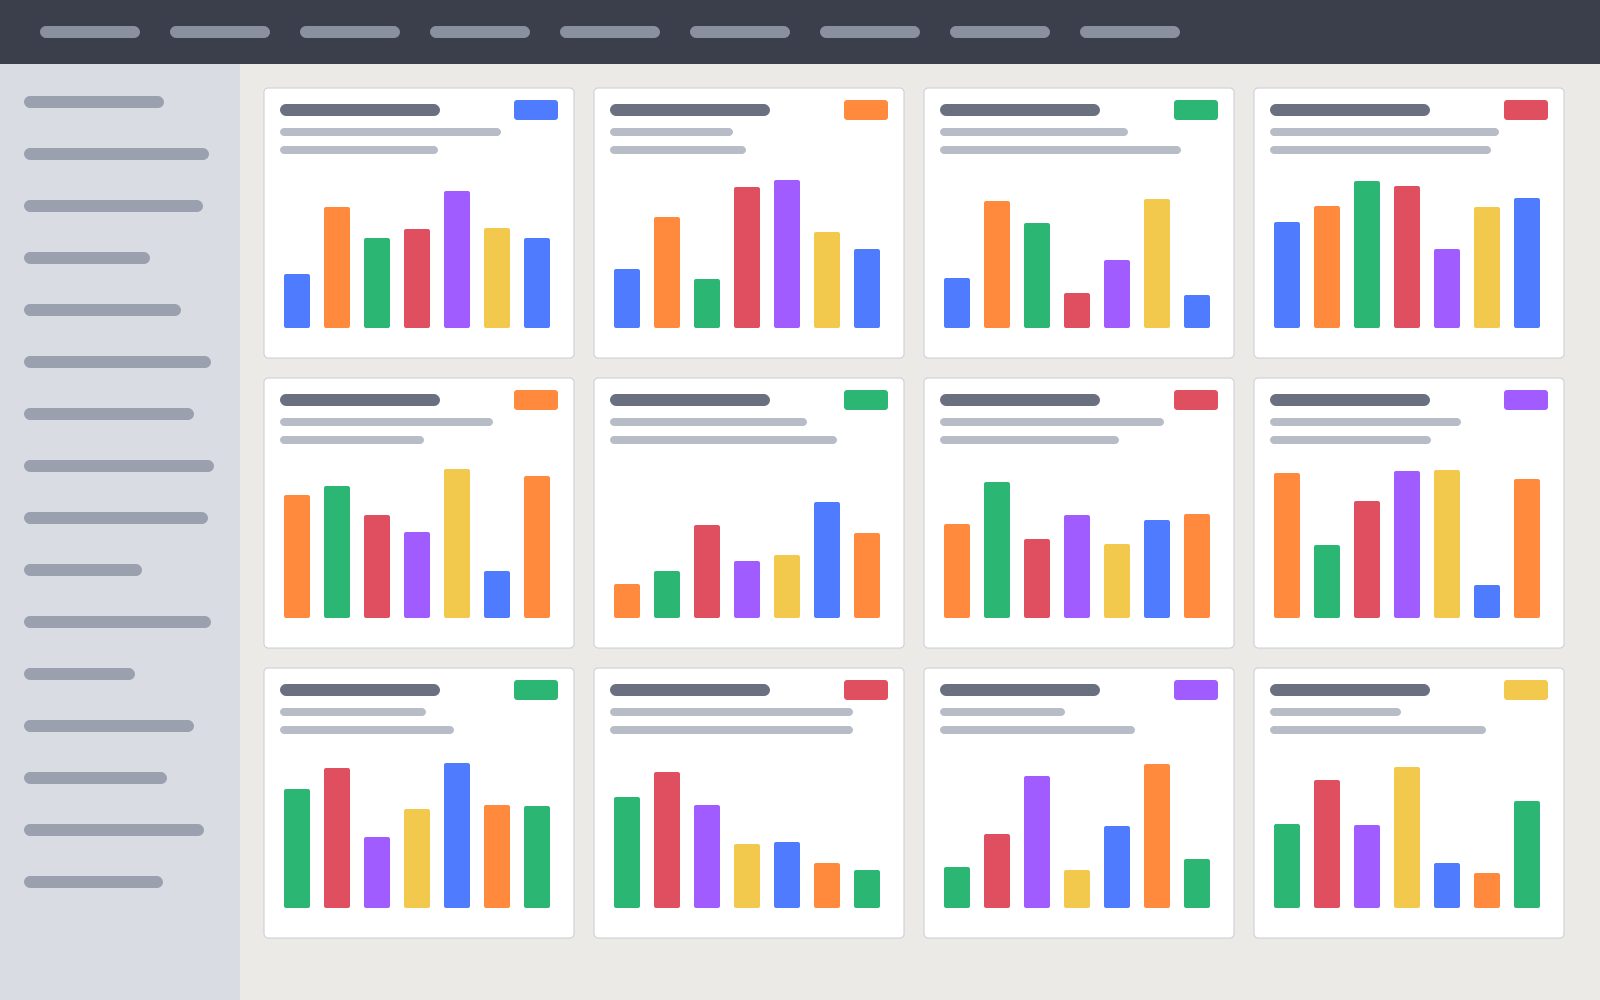
Northfield’s clients trusted the firm with their savings, but they didn’t trust the app. Balances were buried under twelve competing widgets, terminology changed from screen to screen, and every new feature arrived with its own visual dialect. Engagement was falling, and the support team spent a third of its week explaining numbers that the interface should have explained itself.
The brief
Leadership asked for “a redesign”. After two weeks of interviews it was clear the real problem was upstream: nobody had agreed what the product was for. Before drawing anything, we needed a shared answer.
What we heard
Clients wanted three things: to know what they had, whether it was on track, and what — if anything — to do next.
What we had
Forty-one dashboard modules, five button styles, two definitions of “balance” and no owner for the overall experience.
Before & after
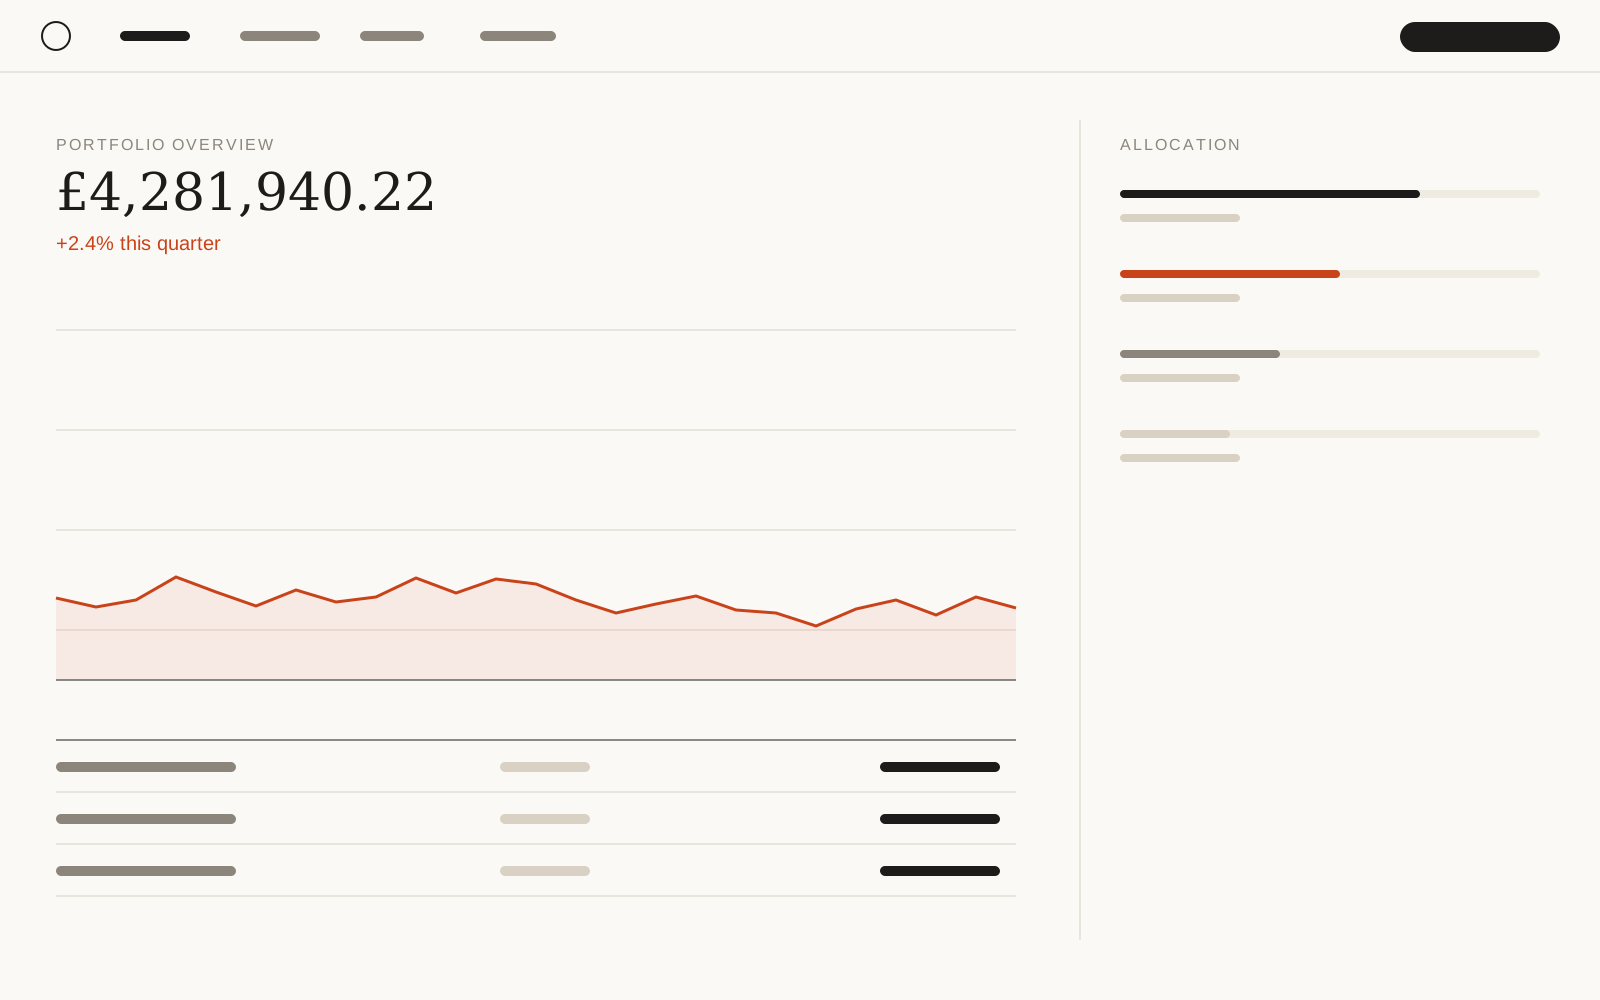
The overview went from a wall of equal-weight charts to a single, ranked story: the number that matters, its trend, then the detail.
Choosing the approach
We weighed three routes with the leadership team. Extending the existing front end won: it kept the data layer the engineers trusted and let us ship in slices.
| Criterion | Rebuild | ExtendChosen | Buy |
|---|---|---|---|
| Time to first release | 9 months | 6 weeks | 3 months |
| Keeps existing data layer | — | ● | — |
| Ships in slices | — | ● | ● |
| Owns the experience | ● | ● | — |
| Estimated cost | £££ | £ | ££ |
A system, not a skin
The design system was the real deliverable. Tokens for colour, type, spacing and motion; 34 components; and — most importantly — a contribution model so the in-house team could extend it without me.
- 01DiscoveryInterviews, analytics, audit
- 02StrategyThree questions, roadmap
- 03FoundationsTokens, type, grid
- 04Components34 components, docs
- 05RolloutOverview, holdings, transfers
Outcomes
41%
Our product finally looks like the company we’re trying to be.
Notes & sources
- 01Client interviews, n=18 — Weeks 1–2
- 02Support ticket analysis — 6 months of tickets, categorised
- 03WCAG 2.2
Sample case study. Client name, figures and details are illustrative and included to demonstrate the template.